Global Logistics Update
Freight Market Update: July 11, 2024
Updates from the global supply chain and logistics world | July 11, 2024
Freight Market Update: July 11, 2024


July 11, 2024
Trends to Watch
[Ocean - Extreme Weather Alert]
- Vessels have resumed transiting around the Cape of Good Hope, following the extreme weather in the region earlier. Wave heights have reduced to 23-26 feet and are expected to continue decreasing. Estimated arrival times for vessels have been delayed by 24-48 hours, and some vessel bunching may occur at ports globally.
Ocean - TPEB
- Volumes remain strong, surpassing last year’s numbers on Transpacific routes. However, structurally blank sailings have occurred due to Cape of Good Hope (COGH) routings and port congestion in Asia and North America. We see more premium offerings from shipping lines with expedited services and equipment and space guarantees, while other carriers try to reduce the backlog in Asia with extra loader (XL) space. With XL space to the Pacific Southwest (PSW), the situation is improving week over week, while the East Coast (EC) remains heavily overbooked.
- Floating rates: The General Rate Increase (GRI) for July was successfully implemented on all Transpacific Eastbound gateways based on the peak conditions we’re seeing this month. Shipping lines adjusted rates to the EC twice as much as to the West Coast (WC) to manage the massive booking intake. We’re seeing the first signs that rates will get extended into the second half of July.
- Fixed rates: Carriers shared the new Peak Season Surcharge (PSS) for July 1, marking another increase after two successful implementation rounds. We’re expecting that the PSS will get extended into the second half of July.
Ocean - FEWB
- Equipment shortages and port congestion in Asia are improving, but on-time performance still falls short of 50% (per the latest Sea-Intelligence report). There are 10 blank sailings announced for Asia-North Europe in the second half of July and August.
- Floating rates rose again for the second half of July (by $500-800 per 40-foot container). Vessels remain full as the capacity cuts and bookings kick in, and customers are still looking for earlier estimated times of departure (ETDs) to mitigate cargo delays.
- Premium options are still available for getting cargo loaded on earlier departure dates with higher equipment priority, which can mitigate the risk of rolling or no equipment.
Ocean - TAWB
- The congestion in the Mediterranean, along with schedule reliability issues and blank sailings, remains the same, leading to increased rates for July.
- North Europe demand has not been affected by the reduced capacity, and the majority of carriers are extending their rate levels until the end of Q3.
- Equipment deficits in certain areas of South/East Germany and the Hinterlands remain an issue.
- To ensure the smoothest loading experience, we recommend booking 1-2 weeks in advance for bookings Ex. North Europe, and 2-3 weeks in advance for bookings ex Mediterranean that are loading at a coastal port.
Ocean - U.S. Exports
- Ocean rates for Q3 are increasing in corridors of the U.S. export market due to rising demand in global container markets.
- Congestion at critical transhipment hubs is reducing effective capacity for U.S. exporters.
- Navigating the ever-changing earliest return dates (ERDs) has become increasingly challenging due to current market congestion.
- To ensure the smoothest loading experience, we recommend booking 3-4 weeks in advance for shipments loading at a coastal port, and 4+ weeks in advance for shipments loading at an inland rail point.
Air - Global (Data Source: WorldACD and TAC Index)
- Global tonnages (+10%) and rates (+9%) continue to show strong YoY improvements, driven by the Red Sea crisis and e-commerce. That said, there are major differences across trade lanes.
- Continuous rate increases in Asia (+18% YoY) and the Indian subcontinent (+55% YoY) over the past 5 weeks have been driven by ocean to air conversions.
- American and European export rates declined YoY due to additional passenger capacity (passenger travel is on the rise).
- Rates from major China hubs have slowly but continuously creeped up since Q1, reaching more than $6/kg at quarter-end in June. They should stabilize in July (a slow ecommerce season), then ramp back up in September.
- Rates have risen dramatically from Southeast Asia origins, particularly Vietnam, driven by increased demand (ocean to air conversions) and congestion at major CN/HK hubs due to e-commerce. Express shipments from Vietnam reached > $10/kg at quarter-end.
- Rates from the Indian Subcontinent remain elevated, with backlogs at most major Indian airports and severe congestion in Bangladesh.
- Ecommerce players expect a strong peak season with 20-30% more volume (and up to 60% more volume in the weeks leading up to Black Friday).
- Traditional shippers are expecting strong Q4 sales. In particular, we expect strong volumes from Apple launches (the iPhone 16 contains a number of new features).
- Capacity is largely sold out from Asia for Q4 2024. Most Asian carriers are sold out of their ad hoc charter capacity until the end of the year, and sold > 85% of scheduled capacity. European, U.S., and Middle Eastern carriers (including Flexport on our own charters) have sold > 80% of their fixed capacity already, only setting aside space for profitable spots.
- Flexport advises that shippers reserve capacity as soon as possible. Focus on forwarders that have strong Block Space Agreements (BSAs) and a solid charter base to mitigate delays, be flexible with booking sizes, and explore creative routing for cargo that can wait.
Please reach out to your account representative for details on any impacts to your shipments.
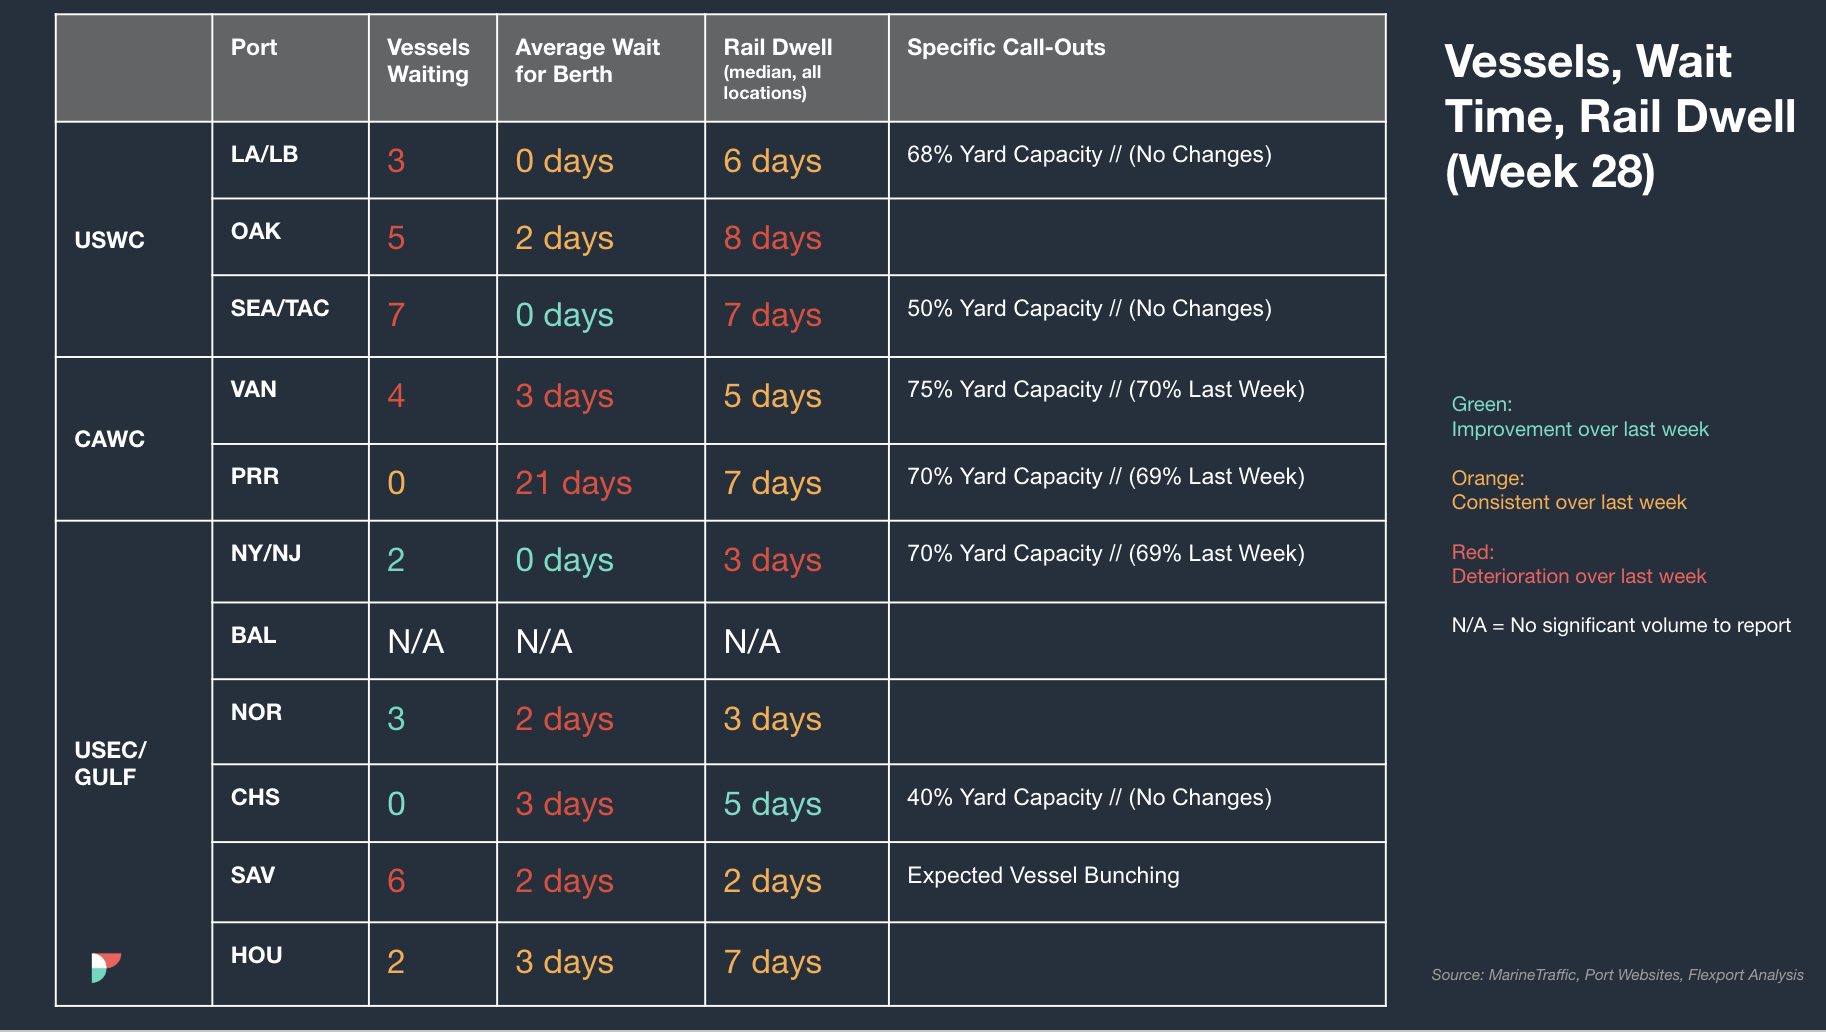
North America Vessel Dwell Times
Webinars
North America Freight Market Update Live
Thursday, July 11 at 9:00 am PT / 12:00 pm ET
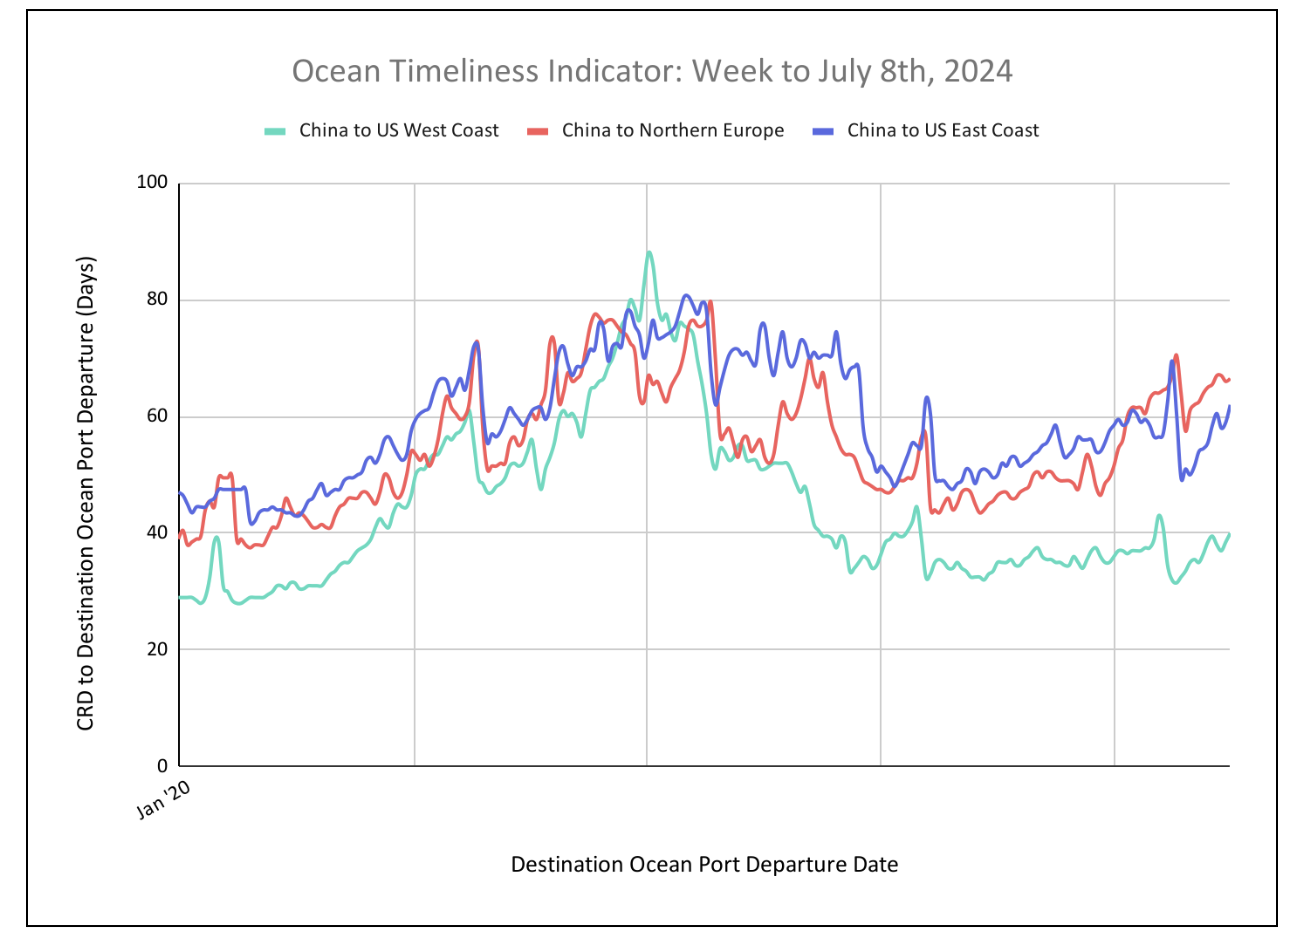
Flexport Ocean Timeliness Indicator
Ocean Timeliness Indicators explore a new trajectory for Europe while returning to former patterns for U.S.-bound routes.
Week to July 8, 2024
This week, the Ocean Timeliness Indicator for China to the U.S. East Coast continues its ascent after its first decrease in 6 weeks, going from 59 days to 62 days. In a similar upturn, the OTI for China to the U.S. West Coast also increased from 38.5 days to 40 days. Last but not least, China to Northern Europe OTIs also began rising, with a small uptick from 66 days to 66.5 days due to port congestion nearing pandemic highs, and also delays caused by extreme weather around the Cape of Good Hope.
Please direct questions about the Flexport OTI to press@flexport.com.
See the full report and read about our methodology here.
The contents of this report are made available for informational purposes only. Flexport does not guarantee, represent, or warrant any of the contents of this report because they are based on our current beliefs, expectations, and assumptions, about which there can be no assurance due to various anticipated and unanticipated events that may occur. Neither Flexport nor its advisors or affiliates shall be liable for any losses that arise in any way due to the reliance on the contents contained in this report.
About the Author
July 11, 2024


Sign up for Global Logistics Update
Why search for updates when we can send them to you?
Related content


More from Flexport
![GettyImages-1176597504]()
Global Logistics Update
CIT Broadens IEEPA Refund Order; FEWB and TAWB See High Vessel Utilization
![Compliance GettyImages-1372697412]()
Global Logistics Update
CBP Makes “Satisfactory” Progress on Automatic IEEPA Refund System; Air Market Braces for Significant Fuel Surcharge Increases
![GettyImages-136886416]()
Global Logistics Update
U.S. Launches New Section 301 Investigations; Middle East Escalation Drives Ongoing Ocean and Air Disruptions


Sign up for Global Logistics Update
Why search for updates when we can send them to you?