Market Update
Freight Market Update: June 27, 2024
Updates from the global supply chain and logistics world | June 27, 2024
Freight Market Update: June 27, 2024


Trends to Watch
[Ocean - TPEB]
- Volumes remain strong and exceed last year’s numbers on the Transpacific route, despite structurally blank sailings caused by Cape of Good Hope (COGH) routings and port congestion in Asia and North America. Shipping lines are offering more services, including expedited service and equipment and space guarantees, while other carriers are attempting to reduce the backlog in Asia with extra loader (XL) space. Due to XL space en route to the Pacific Southwest (PSW), we see that the situation is improving week over week, although the East Coast (EC) is still heavily overbooked.
- Floating rates: All General Rate Increases (GRIs) for June have been implemented, with further rounds expected for all Transpacific Eastbound gateways due to peak conditions anticipated in July. Shipping lines will adjust rates to the EC twice as much as to the West Coast (WC) to manage high booking volumes.
- Fixed rates: Carriers have announced the new Peak Season Surcharge (PSS) for July 1st, marking another increase after two successful implementation rounds earlier this year.
[Ocean - FEWB]
- Equipment shortages have become severe in most of Asia's main loading ports. Liners are repositioning empty containers to improve the situation, but with continued vessel delays caused by rerouting via the Cape of Good Hope, we foresee these issues persisting in the coming weeks.
- Port congestion in Asia is easing, though shippers still face an additional 2-3 days in berthing lead time.
- Demand remains stronger than usual, with rates rising again in the first half of July (a $1,500-2000 increase per 40-foot container). Due to equipment shortages, we expect that customers will keep pushing cargo out to avoid further delays. Liners are announcing blank sailings for July & August already, expecting that market space will remain critical in the coming weeks.
- Shippers are pushing for earlier cargo departures to avoid further freight cost increases. Unless space has already been secured, all vessels are currently full. To expedite cargo departures and avoid delays, more carriers are open to premium options to get cargo loaded on the first available departure date with higher equipment priority.
- Flexport is continuing to monitor the situation and advises booking early, placing bookings in smaller slots, and picking up empty containers as soon as possible. For urgent cargo with a target delivery date, we recommend choosing premium options as early as possible.
[Ocean - TAWB]
- In North Europe, demand is stable, and carriers are extending their rate levels until August and September. However, there are equipment issues in Southern and Eastern Germany and the Hinterlands, including Austria, Hungary, Slovakia, Czech Republic, and Switzerland.
- In the West Mediterranean, congestion and equipment issues at certain main ports, coupled with reduced schedule reliability, are impacting the market. Carriers are implementing increases starting in July, as demand picks up.
- The East Mediterranean is also experiencing the effects of congestion in Mediterranean ports. Some carriers have announced equipment imbalance and operational charges in response to increased costs along the Mediterranean to U.S. routes, as well as equipment availability issues in certain areas of Turkey, Greece, and Egypt.
- To ensure the smoothest loading experience, we recommend booking 2-3 weeks in advance.
[Ocean - U.S. Exports]
- Ocean rates for Q3 are increasing in the broader U.S. export market, driven by rising rates in global container markets.
- Congested key destination transhipment hubs for U.S. exporters include ports in Asia and the Mediterranean.
- To ensure the smoothest loading experience, we recommend booking 3-4 weeks in advance for coastal port loadings, and 4+ weeks in advance for inland rail point loadings.
[Air - Global] (Data Source: WorldACD)
- From January to May 2024, total worldwide chargeable weight was up by 12% year over year (YoY), driven by strong growth in cross-border e-commerce and sea-to-air conversions.
- General cargo growth: General cargo air freight tonnages rose by 13% YoY in the first five months of 2024, surpassing the 10% growth in special cargo.
- Regional performance: The Asia-Pacific and Middle East and South Asia (MESA) regions experienced significant YoY increases in chargeable weight, with the Asia-Pacific up 20% and MESA up 22%, both driven by strong cross-border e-commerce and sea-to-air conversions.
- Product category trends: Vulnerable/high-tech cargo and meat shipments grew by 25% each. Dangerous goods and pharma/temperature-controlled traffic grew by only 2% and 1%, respectively. Fish and seafood shipments declined by 1%, and live animal shipments dropped by 7%.
- Rate stability: Air cargo rates are holding firm at an average of $2.51 per kilo, up 8% YoY and 42% above pre-COVID levels, driven by strong demand and high spot rates from Asian and Middle Eastern origins.
- Market dynamics: Despite a 2% slip in worldwide tonnages in mid-June, a two-week comparison shows a 1% rise in both rates and tonnages, with significant rate increases on lanes such as Asia Pacific-USA and China-USA, and a notable impact from canceled freighters from China to LAX.
- Capacity platforms: Freighters showed weaker growth (+6% YoY) than passenger aircraft and mixed fleets, both of which grew by 13% in the first five months of 2024.
Please reach out to your account representative for details on any impacts to your shipments.
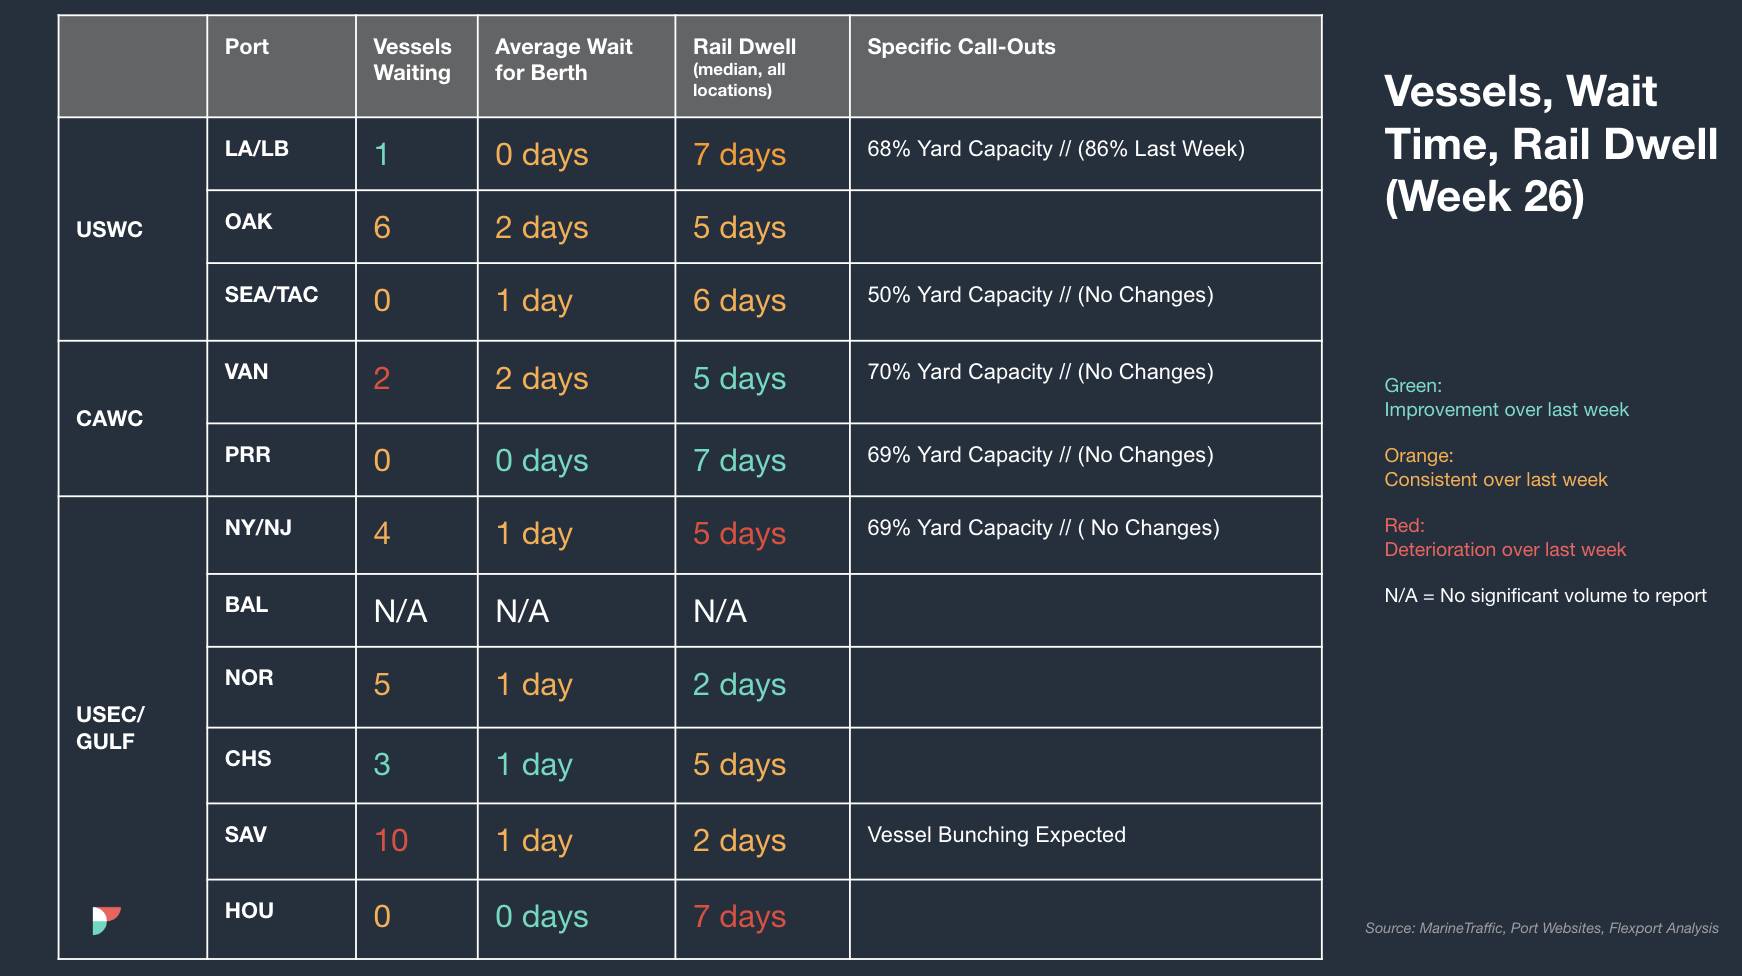
North America Vessel Dwell Times
Webinars
Revolutionize Your Fulfillment: Scale with SHEIN Marketplace
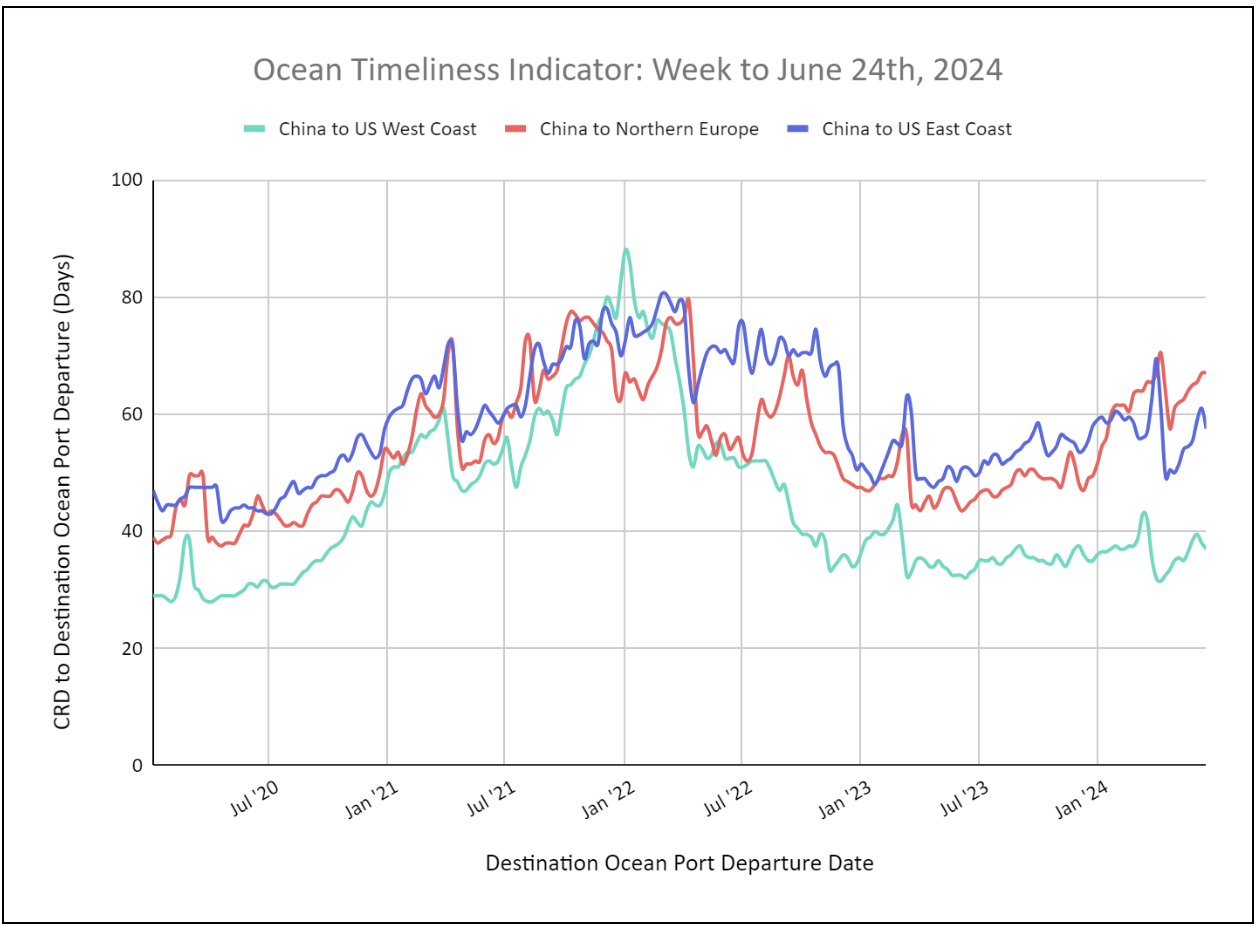
Flexport Ocean Timeliness Indicator
Ocean Timeliness Indicators Remain Stagnant or Decrease Across All Major Trade Lanes
Week to June 24, 2024
This week, the Ocean Timeliness Indicator for China to the U.S. East Coast decreased for the first time in 6 weeks, falling to 58 days. China to the U.S. West Coast OTI also decreased to 37 days. China to Northern Europe OTI remained stagnant at 67 days due to routing around the Cape of Good Hope.
Please direct questions about the Flexport OTI to press@flexport.com.
See the full report and read about our methodology here.
The contents of this report are made available for informational purposes only. Flexport does not guarantee, represent, or warrant any of the contents of this report because they are based on our current beliefs, expectations, and assumptions, about which there can be no assurance due to various anticipated and unanticipated events that may occur. Neither Flexport nor its advisors or affiliates shall be liable for any losses that arise in any way due to the reliance on the contents contained in this report.
About the Author


Sign Up for Global Logistics Update
Related Content


Sign Up for Global Logistics Update
Why search for updates when we can send them to you?